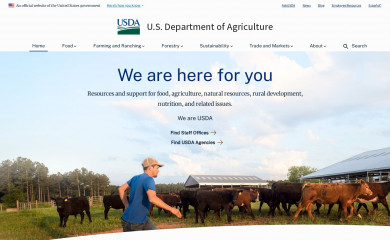
Summary of technologies used by websites hosted on USDA
Domain | Traffic Rank | Top Level Domain | Last Crawled | |
---|---|---|---|---|
usda.gov | 700 - 799 | Government (.gov) | 2 weeks ago | View URLs |
choosemyplate.gov | 30,000 - 39,999 | Government (.gov) | 2 years ago | View URLs |
myplate.gov | 30,000 - 39,999 | Government (.gov) | 2 months ago | View URLs |
dietaryguidelines.gov | 40,000 - 49,999 | Government (.gov) | 4 months ago | View URLs |
nwcg.gov | 50,000 - 59,999 | Government (.gov) | 1 year ago | View URLs |
drought.gov | 70,000 - 79,999 | Government (.gov) | 11 months ago | View URLs |
farmers.gov | 100,000 - 199,999 | Government (.gov) | 1 month ago | View URLs |
ag.gov | 600,000 - 699,999 | Government (.gov) | 7 months ago | View URLs |
biopreferred.gov | 700,000 - 799,999 | Government (.gov) | 1 year ago | View URLs |
carpetmart.com | 800,000 - 899,999 | Commercial (.com) | 2 months ago | View URLs |
The market share for USDA increased by 0.004 percentage points (from 0.003% to 0.007%) for top 100k sites, more than any other segment for the same time period.
Top 1K sites | Top 10K sites | Top 100K sites | Top 1M sites | All Sites | |
---|---|---|---|---|---|
Market Share | 0.1%
| 0.01%
| 0.006%
| 0.001%
| 0.0001%
|
Websites | 1 | 1 | 6 | 10 | 20 |
% Change | 100% | n/a | 133.33% | n/a | n/a |